4G/LTE Bandwidth Logs
Similar to the approach used by Riiser et al., we have performed bandwidth measurements in 4G networks along several routes in and around the city of Ghent, Belgium, during the period of 2015-12-16 to 2016-02-04. Using these measurements, we have built a limited dataset over multiple routes, logging the available bandwidth while downloading a large file over HTTP. To guarantee appropriate download speeds, we hosted a dedicated server in IBCN's Virtual Wall infrastructure, connected through a 100 Mb/s Ethernet connection. As such, bandwidth and latency measurements indicate the performance of the wireless 4G connection, with minimal interference from the wired network. As for the client, we developed an Android application which logs all required information, running on a smartphone connected over 4G (Huawei P8 Lite). The logs are formatted as follows:
- Number of milliseconds since epoch;
- Number of milliseconds since start of experiment;
- GPS latitude in decimal degrees;
- GPS longitude in decimal degrees;
- Number of bytes received since last datapoint;
- Number of milliseconds since last datapoint.
1453121791687 40288 51.0386532820580 3.73222847166054 2763504 1001
1453121792686 41287 51.0386553301824 3.73225142858955 2728896 0999
1453121793686 42287 51.0386567711171 3.73227435543338 1954600 1000
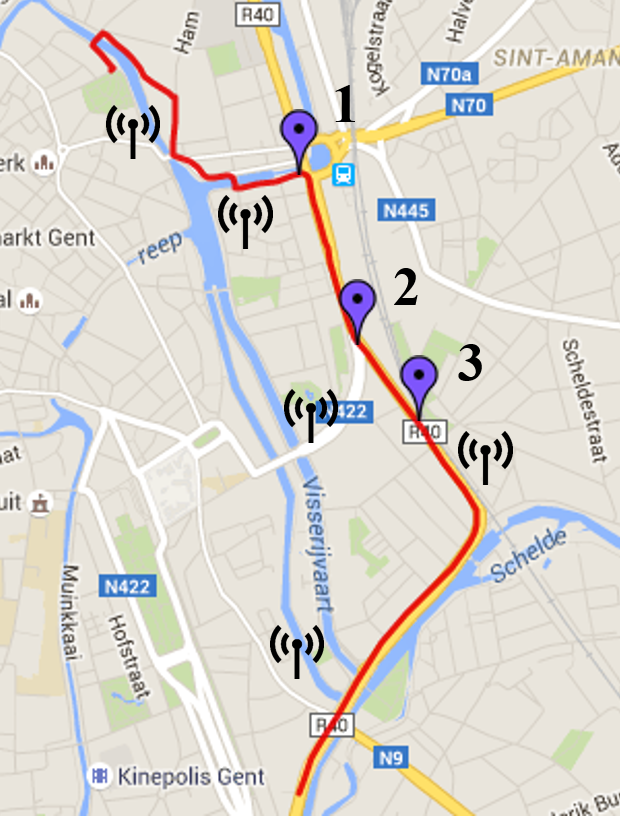
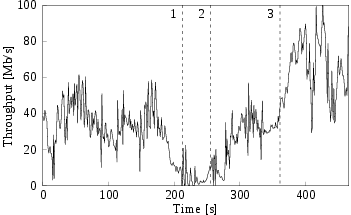
Dividing column 5 by column 6, we arrive at the average throughput in the last interval. Using these values, we can generate traces of the perceived bandwidth over time, and use these as input for simulation and emulation of HAS-based solutions. The images below shows the route taken by a car travelling from north to south (left), along with the measured throughput (right). When travelling from (1) to (2), large townhouses on the right side impede the client's connection. Arriving at (2), the client switches to a new antenna with better coverage. Once an open area is reached in (3) and a new antenna is again selected, throughput improves significantly. Lower values and large downward peaks for the available throughput are observed where connectivity is limited, due to large buildings, tunnels and bad coverage in general.
All logs are sorted based on the type of transportation used: on foot, bicycle, bus, tram, train or car (*). Given the high throughput observed (in some cases up to 95 Mb/s) and the occasional switching to 3G, logs have a relatively limited duration ranging from 166 to 758 seconds. A total of 40 logs were collected, covering 5 hours of active monitoring. All logs can be downloaded here, either as a whole or per transportation type.
If you use the traces, please refer to the related journal paper as follows: "J. van der Hooft, S. Petrangeli, T. Wauters, R. Huysegems, P. Rondao Alface, T. Bostoen, and F. De Turck, HTTP/2-Based Adaptive Streaming of HEVC Video over 4G/LTE Networks, IEEE Communications Letters, vol. 20, no. 11, pp. 2177-2180, 2016." (BibTeX).
(*) The authors would like to thank T. Baele and L. Timperman for their kind assistance during the data collection.