
Ghent University, Belgium
Kenneth Hoste and Lieven Eeckhout
kehoste@elis.ugent.be , leeckhou@elis.ugent.be
[ what? ] :: [ news ] :: [ usage ] :: [ example: SPEC CPU2000 ]

|
Ghent University, BelgiumKenneth Hoste and Lieven Eeckhoutkehoste@elis.ugent.be , leeckhou@elis.ugent.be[ what? ] :: [ news ] :: [ usage ] :: [ example: SPEC CPU2000 ] |
|
| [ download source ] :: [ publications ] :: [ links ] |
Click here for a demo on SPEC CPU2000 data: medium resolution (600x950), large resolution (800x1200).
Oct. 1st 2009
Paper published:
A Methodology for Analyzing Commercial Processor Performance Numbers (pdf)
Kenneth Hoste and Lieven Eeckhout
IEEE Computer, October 2009, vol 42 (10), pp. 70-76
Jan. 10th 2008
Sneak preview of the tool, together with paper submission.
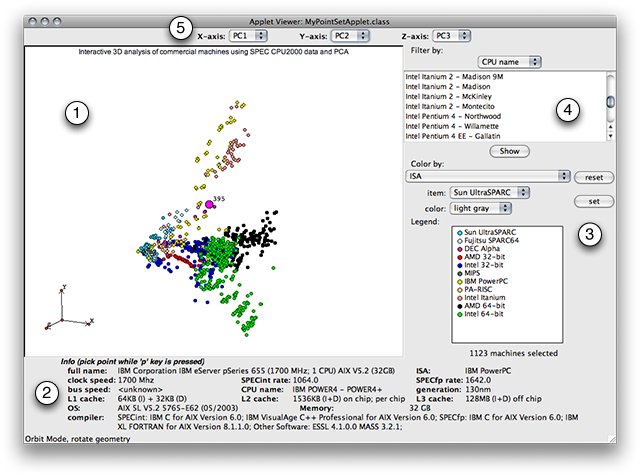
1) Navigation
2) Machine info
3) Coloring
4) Filtering
5) Changing dimensions
An example of a combination of the Java applet with a transformed data set is available here: medium resolution (600x950), large resolution (800x1200). For this example, we used the data set available at the SPEC website (http://www.spec.org/cpu2000/results), which contains performance numbers for the 26 SPEC CPU2000 benchmarks on over 1000 commercial machines. This results in a data set containing performance numbers for each of the 26 benchmarks on 1123 commercial machines (Intel, AMD, IBM, ...). We use the base speed performance numbers. More details on the benchmark suite can be found here.

The first principal component shows similar weights across all benchmarks.
This leads to the conclusion that this underlying behavior corresponds to
average performance across all benchmarks; a machine with a high value along PC1
shows better average performance than a machine with a low value.
Correlation coefficients with the SPECint and SPECfp base scores are 96.9% and
97.4%, respectively.
One benchmark shows a somewhat lower weight: art. This is due to an
aggressive compiler optimization specifically targeted towards this benchmark,
which causes huge speedup ratios on some machines. About 10% of all speedup
ratios for this benchmark is larger than 8,236 (the maximum speedup across the
other benchmarks), reaching up to 26,443.
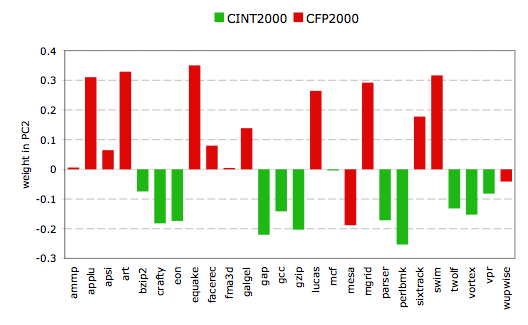
Looking at the weights for the second principal component, we observe that
all SPECint benchmarks get a negative weight, while most of the floating-point
benchmarks get a positive weight. Thus, a machine with a high value along PC2
will shows better relative floating-point performance, compared to integer
performance, and vice versa.
Two notable exceptions here are mesa and wupwise, which show a
negative weight as opposed to the other floating-point benchmarks. Detailed
performance characterization performed with MICA shows that both
benchmarks lean closer towards integer benchmarks regarding their dynamic
behavior than to floating-point benchmarks. A small overview is shown in the
table below.
| characteristic | SPECint | SPECfp | mesa | wupwise |
| ILP (instruction window of 32 entries) | 2.98 - 9.74 | 11.66 - 44.61 (galgel: 10.23) | 7.12 | 11.51 |
| % of instructions which read memory | 6.01% - 30.86% | 2.47% - 12.56% (fma3d: 18.43%) | 21.23% | 12.51% |
| % floating-point instructions | 6.00% - 17.64% (eon: 44.54%) | 30.85% - 92.27% (facerec: 30.85%) | 27.40% | 54.30% |
| stack instructions (POP/PUSH) | 0.21% - 22.25% | 0.00% - 1.96% | 6.83% | 5.05% |
| bit shift instructions | 0.02% - 9.44% | 0.00% - 1.47% | 2.53% | 1.15%% |
| branch predictability (PPM, Gag, 4 bits) | 1.61% - 5.44% mispredicted | 0.01% - 1.06% mispredicted | 1.89% mispredicted | 2.05% mispredicted |
| probability register reuse distance = 0 | 22.20% - 49.72% | 5.74% - 17.81% (equake: 23.34%) | 30.55% | 24.65% |
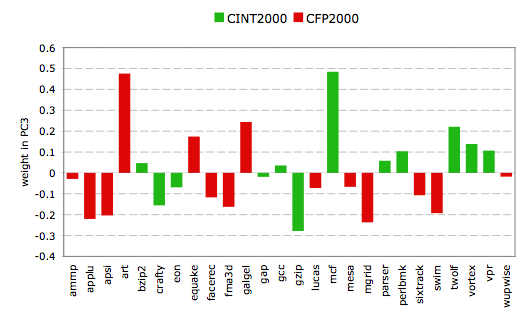
The linear weights for the third principal component show that two
benchmarks get a significantly higher weight compared to the others: art
and mcf. Both benchmarks are known to heavily stress the memory
subsystem, which leads to the conclusion that PC3 discriminates machines based
on performance for memory-intensive workloads. A machine with a high value on
the third principal component will show better performance for memory-intensive
workloads than a machine with a low value.
To quantify this, we can again use the detailed performance characterization
done using MICA. When we
look at the probability that the LRU stack memory reuse distances are smaller
than 1MB (thus will hit in a fully associative 1M cache), we see that most
benchmarks have at least a 95% probability for that to occur. The only two
benchmarks which show different numbers are exactly art and mcf,
which show a 67% and 77% probability, respectively.
The source of the Java applet is available here, with the SPEC CPU2000 data set included in it. Because Java applets can not read files due to security contraints, we hardcode the data set into the applet. Plugging in a different data set can be done by using a script that generates the needed Java files and by subsequently recompiling the applet.